Se me rompió el disco duro y perdí muchas cosas que estaba haciendo, lamento no haber continuado con el tema. Pero volvemos a la carga, de hecho estoy buscando el sistema del VIX, me hago mayor y la memoria se va borrando.
Ahora hemos visto claramente que el mercado ha cambiado y hay que estar muy atento a lo que pueda venir.
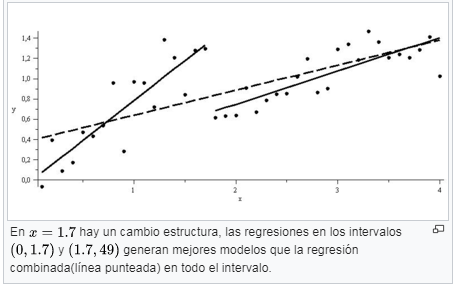
Test de Chow
The Chow test tells you if the regression coefficients are different for split data sets. Basically, it tests whether one regression line or two separate regression lines best fit a split set of data.
Running the Test
The null hypothesis for the test is that there is no break point (i.e. that the data set can be represented with a single regression line).
Run a regression for the entire data set (the “pooled regression”). Collect the error Sum of Squares data.
Run separate regressions on each half of the data set. Collect the Error Sum of Squares data for the two regressions.
Calculate the Chow F statistic using the SSE from each subsample. The formula is: chow-test-formula
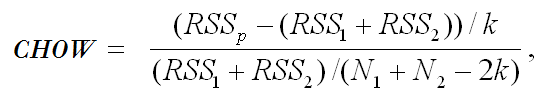
where:
RSSp = pooled (combined) regression line.
RSS1 = regression line before break.
RSS2 = regression line after break.
Find the F-critical value from the F-table.
Reject the null hypothesis if your calculated F-value falls into the rejection region (i.e. if the calculated F-value is greater than the F-critical value).
Este test sirve de una manera cuantitativa saber cuando la tendencia se ha terminado, aunque como se basa en datos pasados, siempre suele llegar tarde. Ahora bien en una tendencia de años es una manera fácil de buscar valores con tendencia.
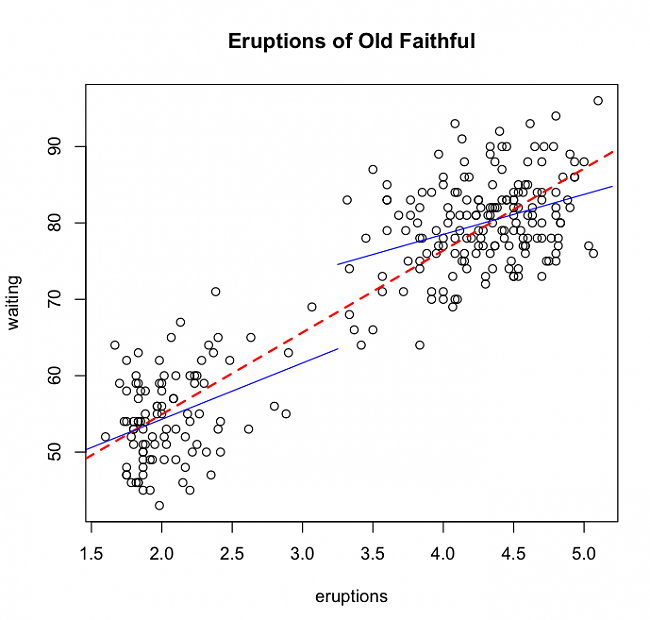
Test de Chow en R
Código PHP:
## Run three regressions (1 restricted, 2 unrestricted)
r.reg = lm(waiting ~ eruptions, data = of)
ur.reg1 = lm(waiting ~ eruptions, data = of[of$eruptions > 3.25,])
ur.reg2 = lm(waiting ~ eruptions, data = of[of$eruptions
## review the regression results
summary(reg.r)
summary(ur.reg1)
summary(ur.reg2)

## Calculate sum of squared residuals for each regression
SSR = NULL
SSR$r = r.reg$residuals^2
SSR$ur1 = ur.reg1$residuals^2
SSR$ur2 = ur.reg2$residuals^2

## K is the number of regressors in our model
K = r.reg$rank

## Computing the Chow test statistic (F-test)
numerator = ( sum(SSR$r) - (sum(SSR$ur1) + sum(SSR$ur2)) ) / K
denominator = (sum(SSR$ur1) + sum(SSR$ur2)) / (nrow(of) - 2*K)
chow = numerator / denominator
chow

## Calculate P-value
1-pf(chow, K, (nrow(of) - 2*K))
https://thetarzan.wordpress.com/2011...ithful-geyser/
https://pythonandr.com/tag/structural-breaks/

 13Likes
 LinkBack URL
 About LinkBacks


 Citar
Citar
Marcadores